The GTR Company Admin Dashboard
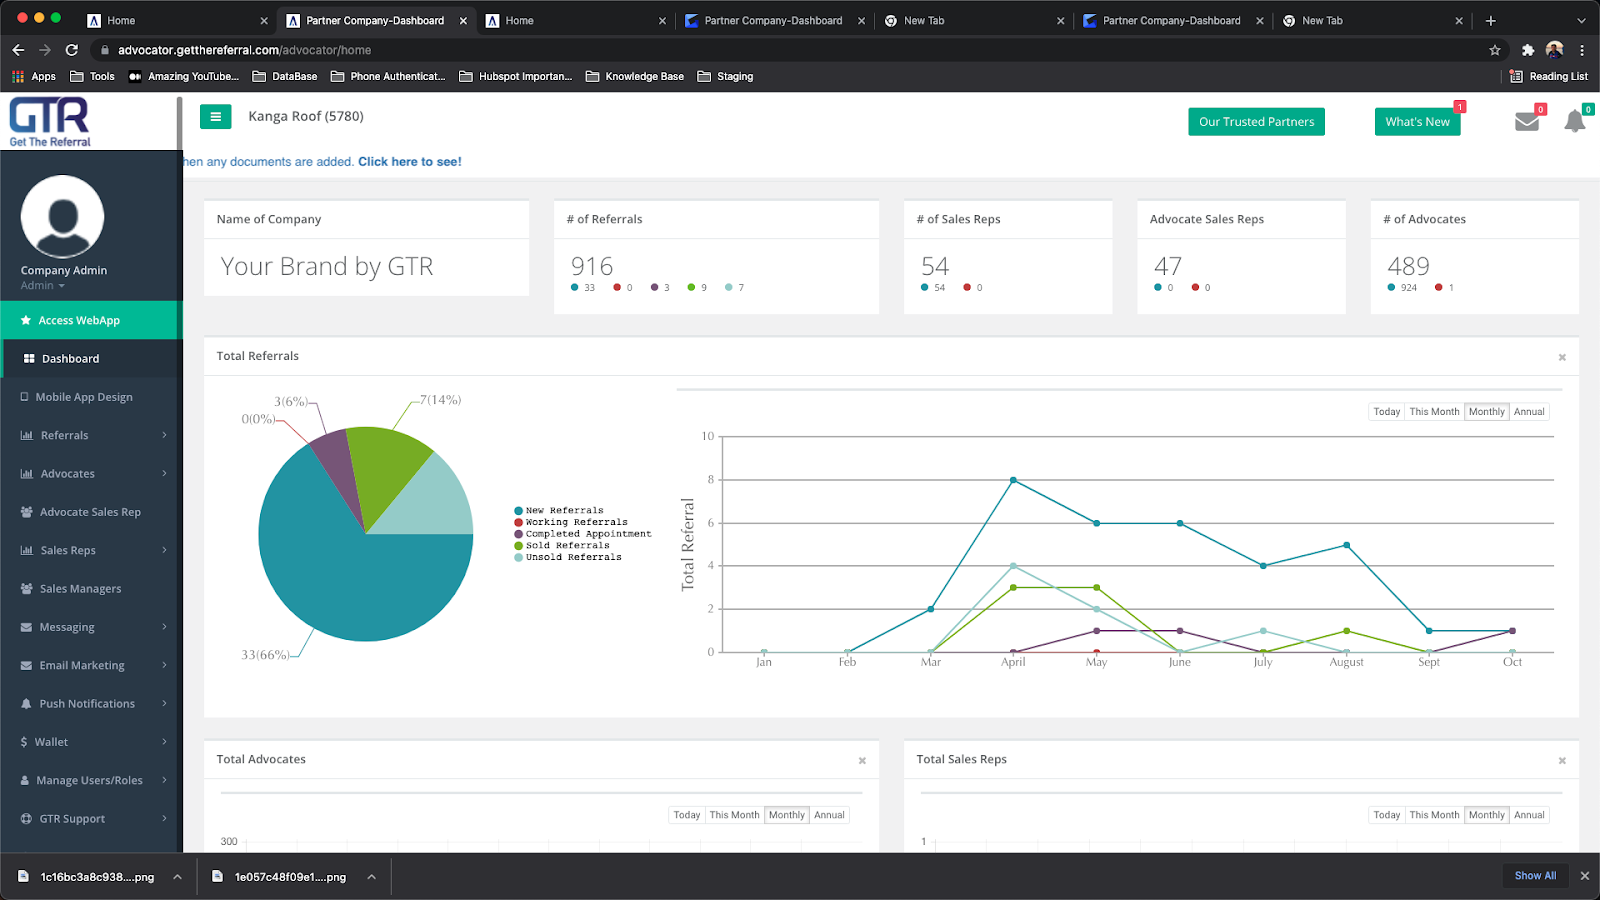
The GTR Company Admin Dashboard is the main page the Company Admin will see to access all features and view insights
The majority of the features will be accessed on the left hand menu, a long with some features on the top right
GTR Dashboard Analytics
For viewing insights,
The main dashboard contains interactive charts so the company admin can view analytics/ performance of your business
Referral & Advocate Data
Not only are there interactive charts, but also data that displays the main focus of GTRs lead driven platform
- # of Referrals
- # of Sales Reps
- # of Advocate Sales Reps
- # of Advocates
Time Series Chart for Referrals
For the interactive charts Company admins can now see referral rates by
- Daily, Current Month, Monthly over the current year and Annual
In addition to the time series chart changing, the pie chart will change with the change in the Time span selected
The ability to hover over the time series chart to describe what referral and count is being viewed can be very helpful for more precise information on the graphs being viewed.
